Comparison of Methods for controlling Population Stratification in GWAS
Objective:
This project implements a full Genome-Wide Association Study (GWAS) workflow to identify genetic variants associated with a binary phenotype, while accounting for population stratification. The analysis uses simulated SNP genotype data and demonstrates several statistical approaches commonly used in modern genetic association studies.
Data Preparation:
The dataset used in this analysis consists of simulated Genome-Wide Association Study (GWAS) data containing genotype information for multiple single nucleotide polymorphisms (SNPs) along with a binary phenotype indicating disease status. Importatntly, the data was simulated, such that only a signle SNP is truley associated with the phenotype, with a true genetic inheritence mode. The genotype matrix contained 300 individuals and 200 SNPs, where each SNP is coded as 0, 1, or 2.
To investigate different possible genetic inheritance patterns, three transformed genotype matrices were constructed corresponding to the dominant, additive, and recessive genetic models. These transformations allow the logistic regression models to test different biological mechanisms through which a SNP may influence the phenotype.
- Additive model: The original SNP coding (0, 1, 2) was retained, representing the number of minor alleles
- Dominant model: Genotypes were recoded as an indicator variable equal to 1 if the individual carried at least one minor allele and 0 otherwise
- Recessive model: Genotypes were recoded as an indicator variable equal to 1 only if the individual carried two minor alleles and 0 otherwise
Statistical Analysis:
For each one of the three genetic inheritance modes, logistic regression models were fitted for each SNP. The association between genotype and phenotype was evaluated using p-values and exponentiated coefficients (odds ratios). Multiple testing was addressed using Bonferroni correction. For each mode the most significant candidate variants were identifid.
Next, population structure, a major confounder in GWAS, was investigated. Two methods for identifying population stratification were compared:
1. Principal Component Analysis
Principal Component Analysis (PCA) was used to detect latent population structure in the genotype matrix.
Logistic regression analyses were repeated after removing the PC1 signal (whitening)
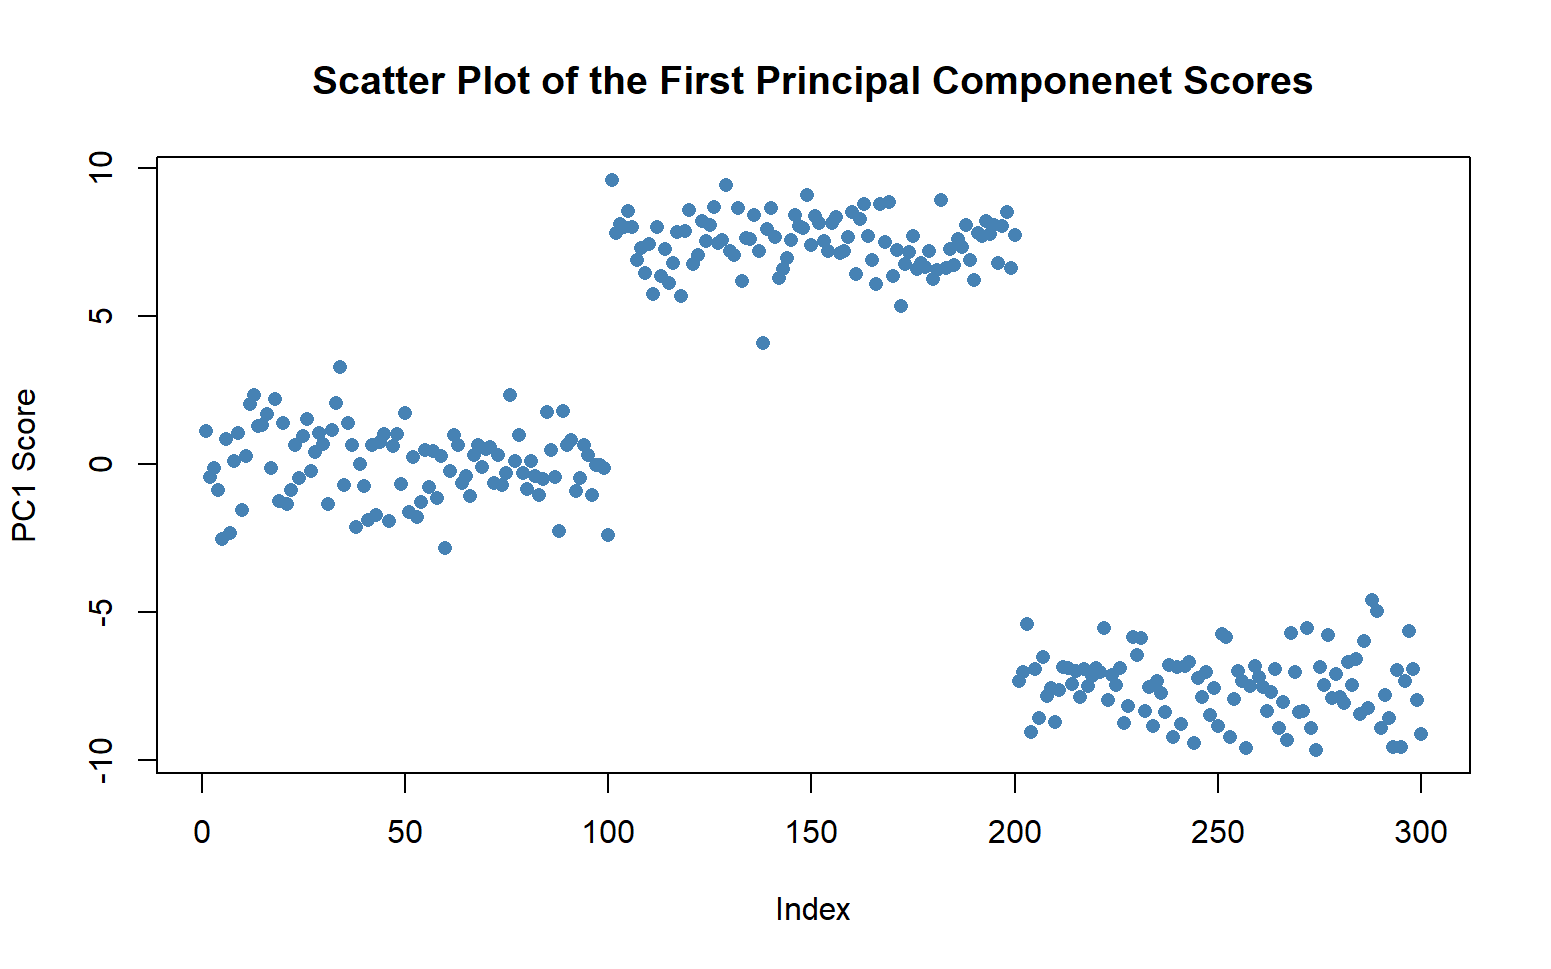
and also by including PC1 as a covariate to correct for stratification. The PC1 clusters can be seen below:
2. Expectation-Maximization
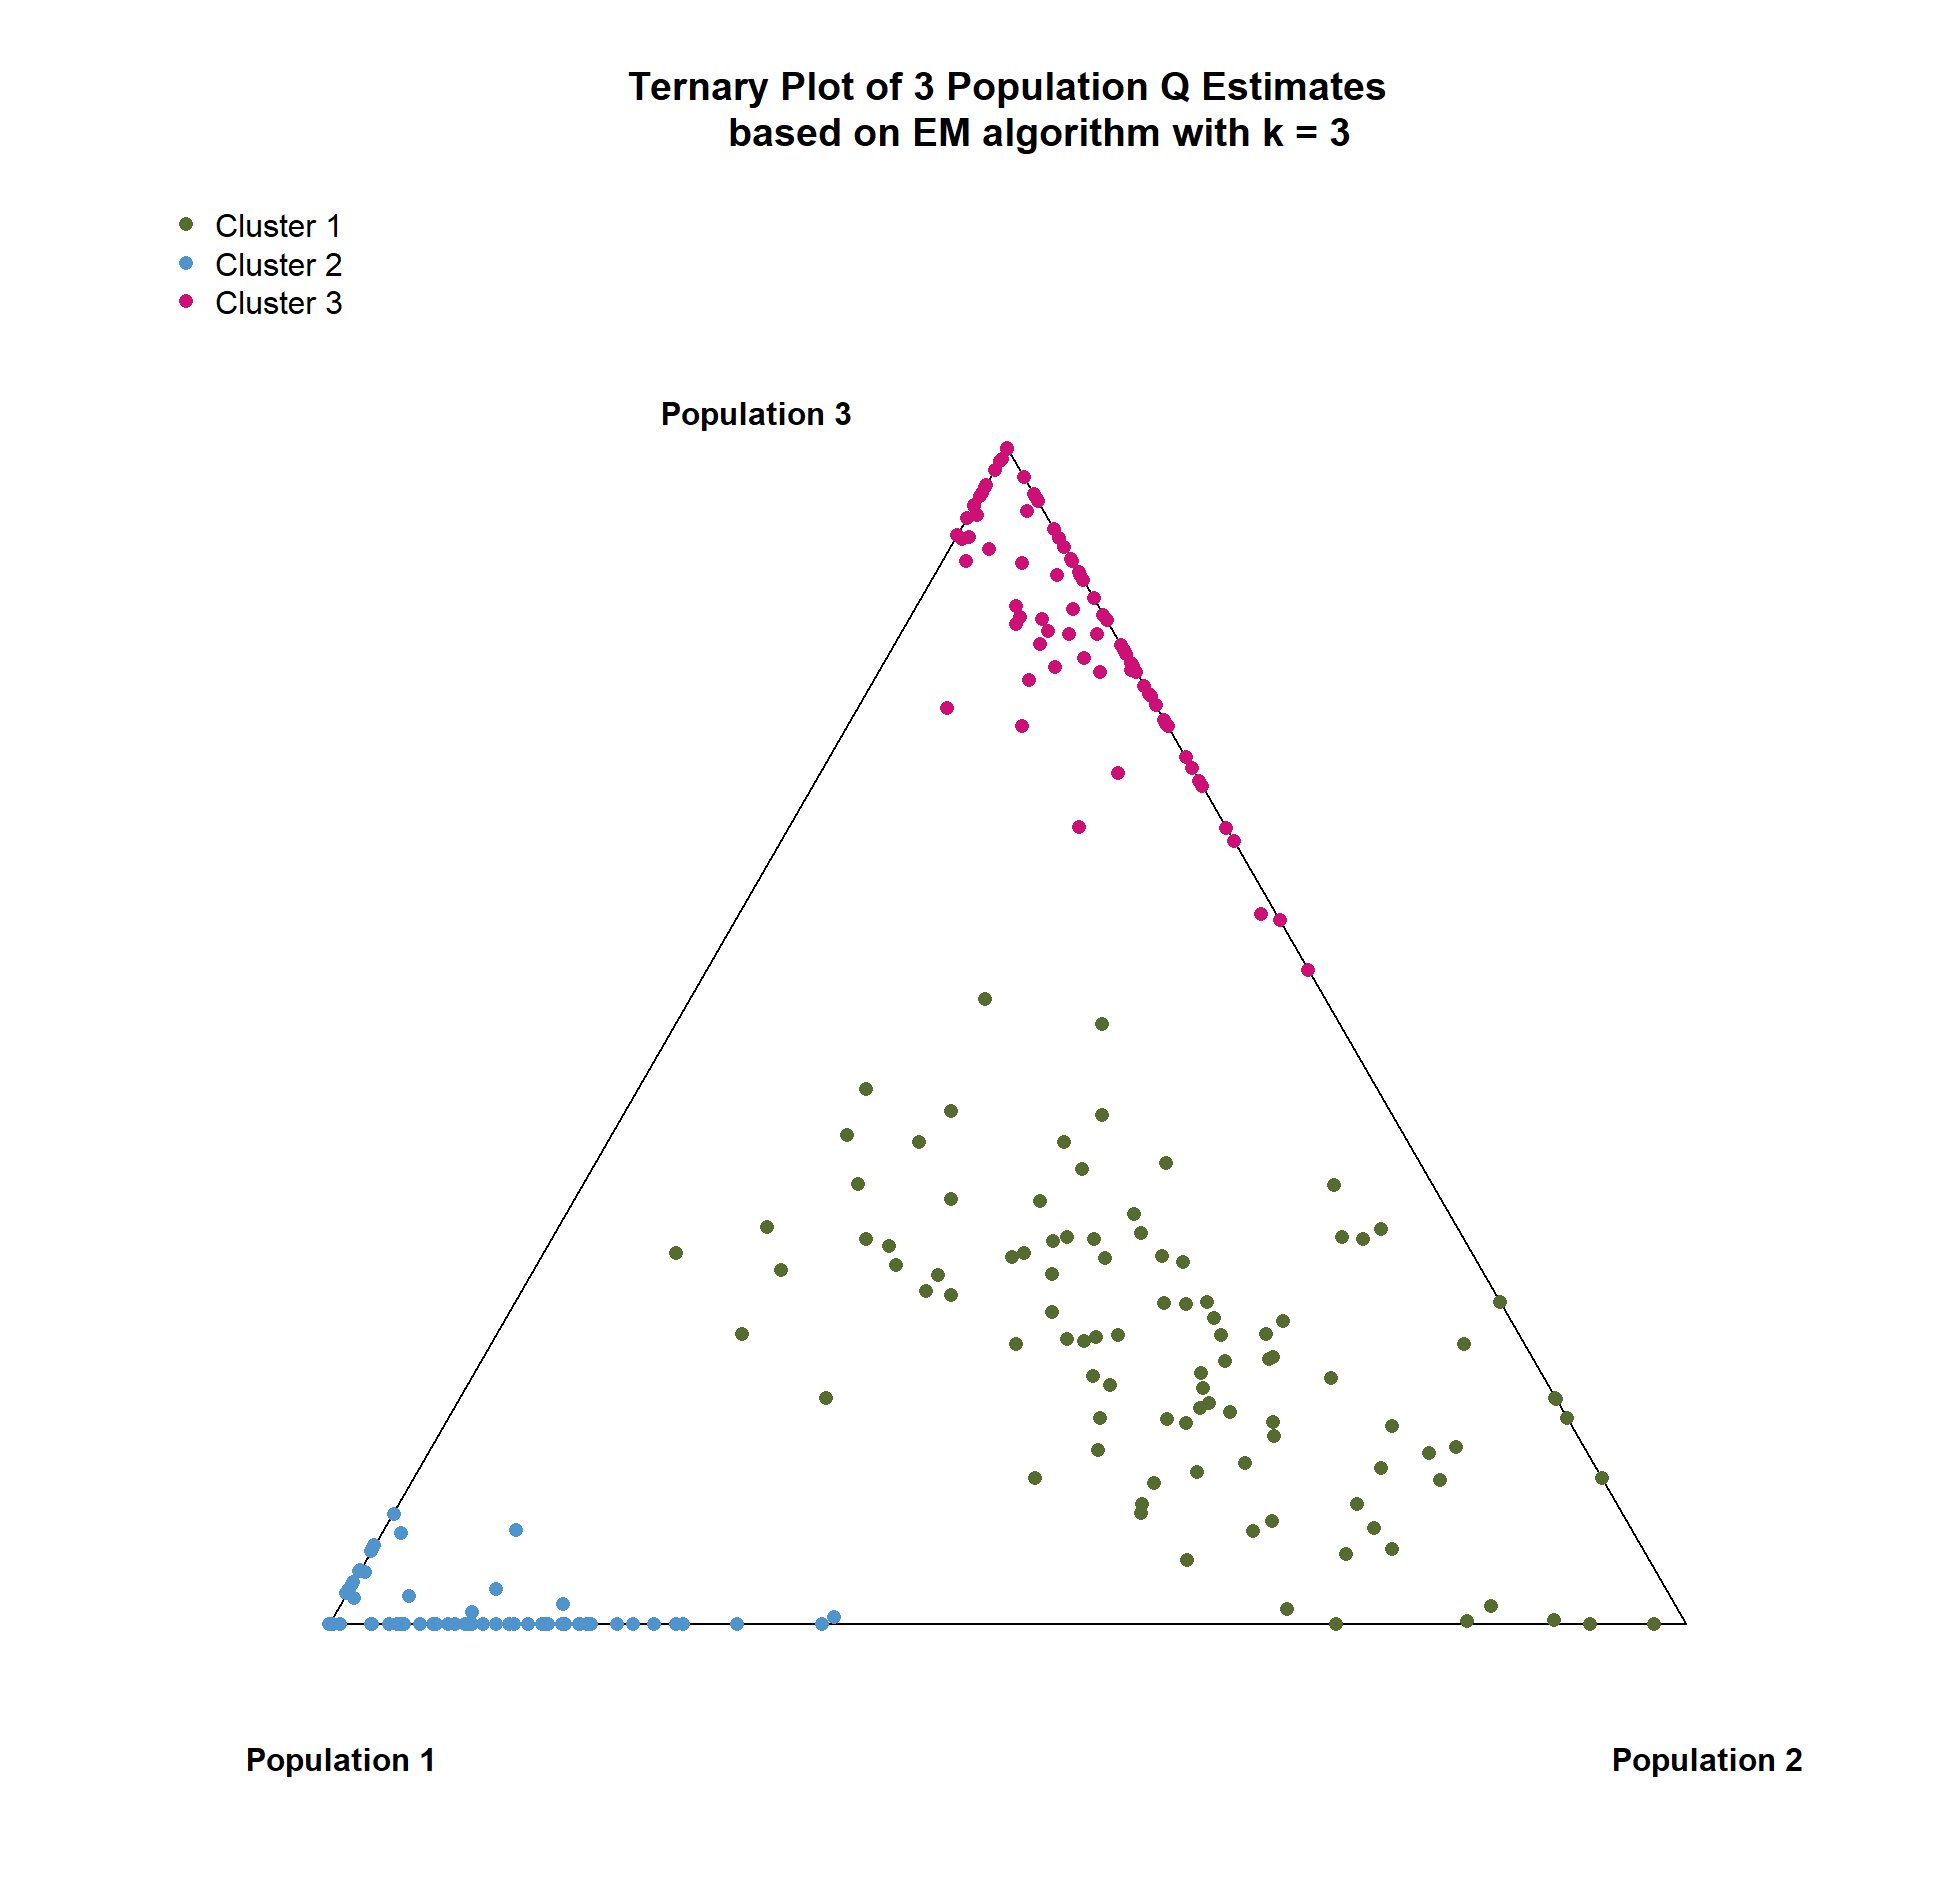
A custom Expectation–Maximization (EM) algorithm was implemented to estimate individual ancestry proportions under mixture models with different numbers of populations. Models with two and three populations were compared using log-likelihood and BIC. The ancestry estimates for the 3-population model is visualized below using a ternary plot:
Finally, the estimated ancestry proportions of the 2-population model were incorporated into the GWAS logistic regression models to control for population stratification.
Results and Conclusions:
The first principal component and 2-population EM algorithm revealed clear clustering of individuals into 3 distinct groups. The results of the 2-population versus 3-population EM models suggested two major ancestral populations with an admixture subgroup. While the 3-population model increased the likelihood, the increase in model parameters when moving from 2 to 3 populations was not justified.
Controlling for population stratification via both methods gave very similar results. While the original logistic regression analysis revealed many significantly associated SNPs (even after accounting for multiplicity via Bonferroni’s correction), controlling for population stratification consistently obtained only the single true SNP as significantly associated with the phenotype, with the (true) additive genetic inheritence model providing the most plausible explanation of the effect (as determined by p-value magnitude).
This simulation indicates that both PCA and EM are powerful identifiers of population structure. Although both methods have their advantages, in this case EM was slightly more useful since it allowed for the comparison of 2 versus 3 population models.