Comparison of Thyroglobulin Measurements Across Various Laboratory Platforms
Objective:
Thyroglobulin (TG) is a key biomarker used in the follow-up of thyroid cancer patients, yet its measurement is known to vary across laboratory platforms and to be affected by the presence of anti-thyroglobulin antibodies (ATG). The primary objective of this project was to compare TG measurements obtained from three commonly used laboratory analyzers (Immulite, Atellica, and Cobas), and to assess their agreement both on a continuous scale and under clinically relevant binary classifications (e.g., normal vs. elevated TG). A secondary objective was to evaluate how ATG levels influence concordance between platforms and identify sources of measurement disagreement.
Data Preparation:
- Integrated laboratory data from multiple Excel sheets corresponding to different assay combinations and patient subsets.
- Identified and separated cases with elevated ATG levels, given their known interference with TG measurement.
- Created categorical TG variables based on clinical thresholds to enable concordance analysis.
- Constructed derived indicators for pairwise agreement and disagreement between platforms.
Statistical Analysis:
1. Continuous Agreement Between Assays
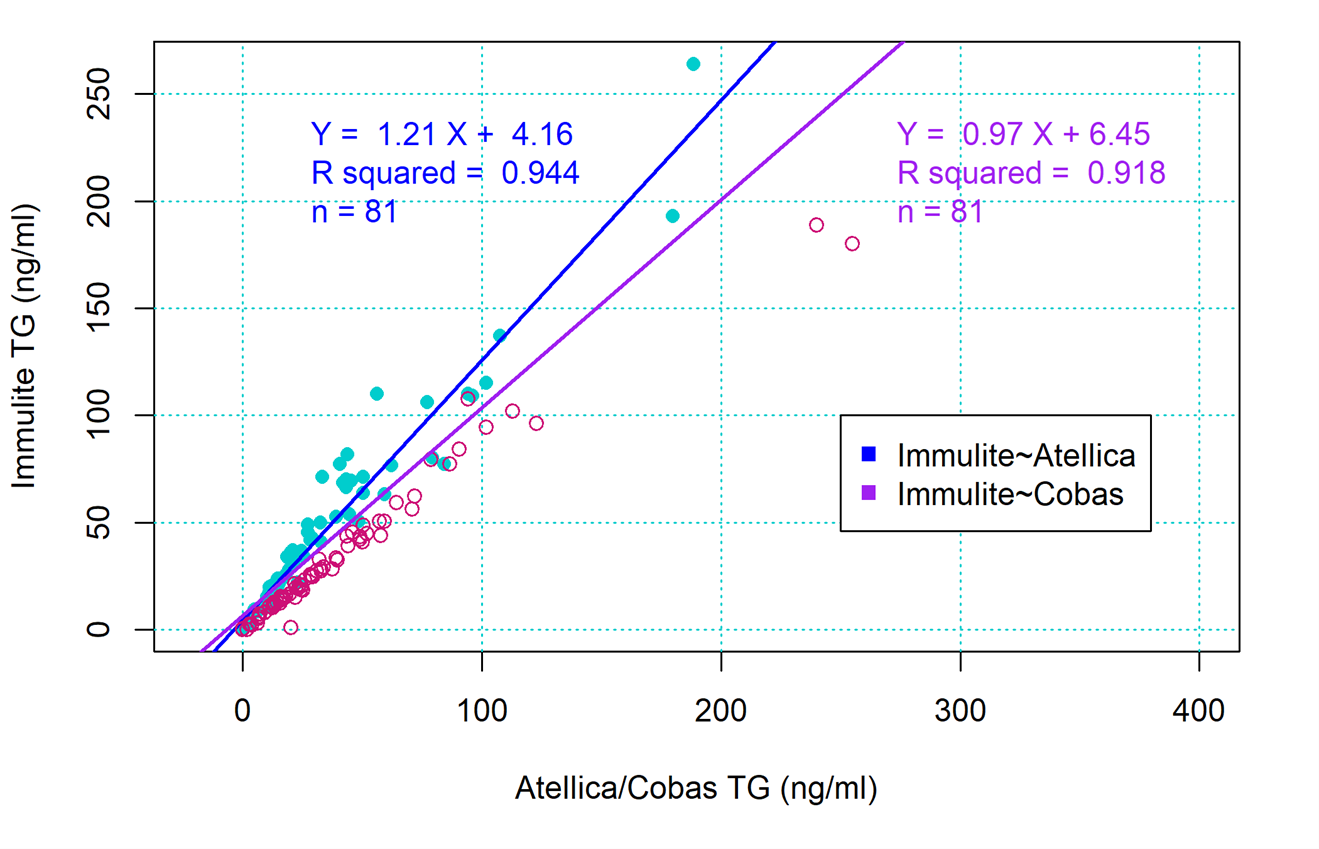
- Fitted linear regression models to compare TG values across platforms (e.g., Immulite vs. Atellica, Immulite vs. Cobas).
- Estimated slopes, intercepts, and coefficients of determination (R²) to assess systematic bias and strength of association.
- Visualized relationships using scatter plots with regression overlays for the full dataset and for subsets, excluding high ATG cases.
2. Sensitivity to Anti-Thyroglobulin (ATG)
- Repeated all analyses after excluding samples with elevated ATG to evaluate how antibody interference affects agreement.
- Compared regression parameters and goodness-of-fit before and after ATG exclusion.
3. Concordance and Misclassification Analysis
- Evaluated agreement between platforms under binary clinical classifications.
- Visualized concordant and non-concordant cases using stratified scatter plots.
- Quantified the contribution of each analyzer to misclassification using summary tables and a pie chart of disagreement sources.
The main results of the regression analysis, post ATG exclusion, are visulaized below:
Reporting Results:
- Produced publication-quality figures illustrating continuous agreement, classification concordance, and sources of disagreement.
- Clearly summarized statistical findings for a clinical audience, emphasizing practical implications rather than model mechanics.
- Highlighted the impact of ATG on assay comparability and identified platforms more prone to discordant classification.
- Supported laboratory and clinical stakeholders in intpreting the results and understanding methodology and inference limitations.